Two Decades of Progress


Since the 2006 release of the Center for Global Development report When Will We Ever Learn: Improving Lives Through Impact Evaluation, and building on evaluations of cash transfer programs in the 2000s, there have been nearly two decades of progress in generating and using evidence for public policy decisions and development programs (Savedoff et al. 2006).
Spotlight on Key Areas of Progress

“The Twenty-First Century Experimenting Society: The Four Waves of the Evidence Revolution” by Howard White (2019)
1. The amount of available funding and number of published impact evaluation studies has significantly increased. As of April 2022, the International Initiative for Impact Evaluation (3ie) evidence portal includes over 10,000 impact evaluation records.
Background paper on evidence-to-policy partnerships by Taddese (2021) with details on the structures and benefits of different models, including evaluation units within governments, knowledge broker platforms, and networks
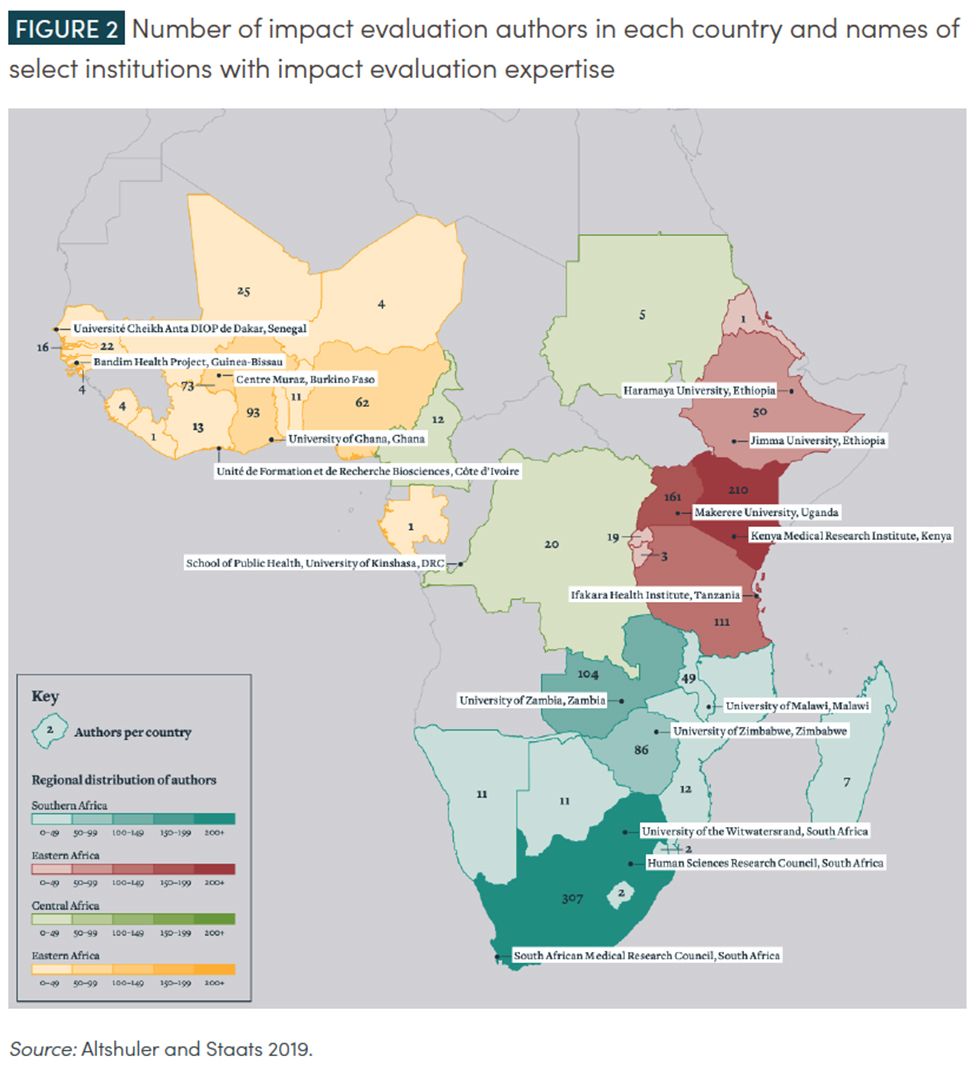
2. The global community of researchers and organizations conducting impact evaluations continues to grow, including those based in low- and middle-income countries.
Evidence-to-policy partnerships that link researchers familiar with the local context to policy opportunities within that specific context are increasingly seen as a key mechanism for strengthening the demand for and use of policy-relevant evidence (Campbell et al. 2009; DuMont 2019; Oliver et al. 2014).

The RECOVR Research Hub collates findings from 10 organizations on the impacts of COVID-19 in low and middle-income countries, reflecting progress in speed, rigor, and accessibility
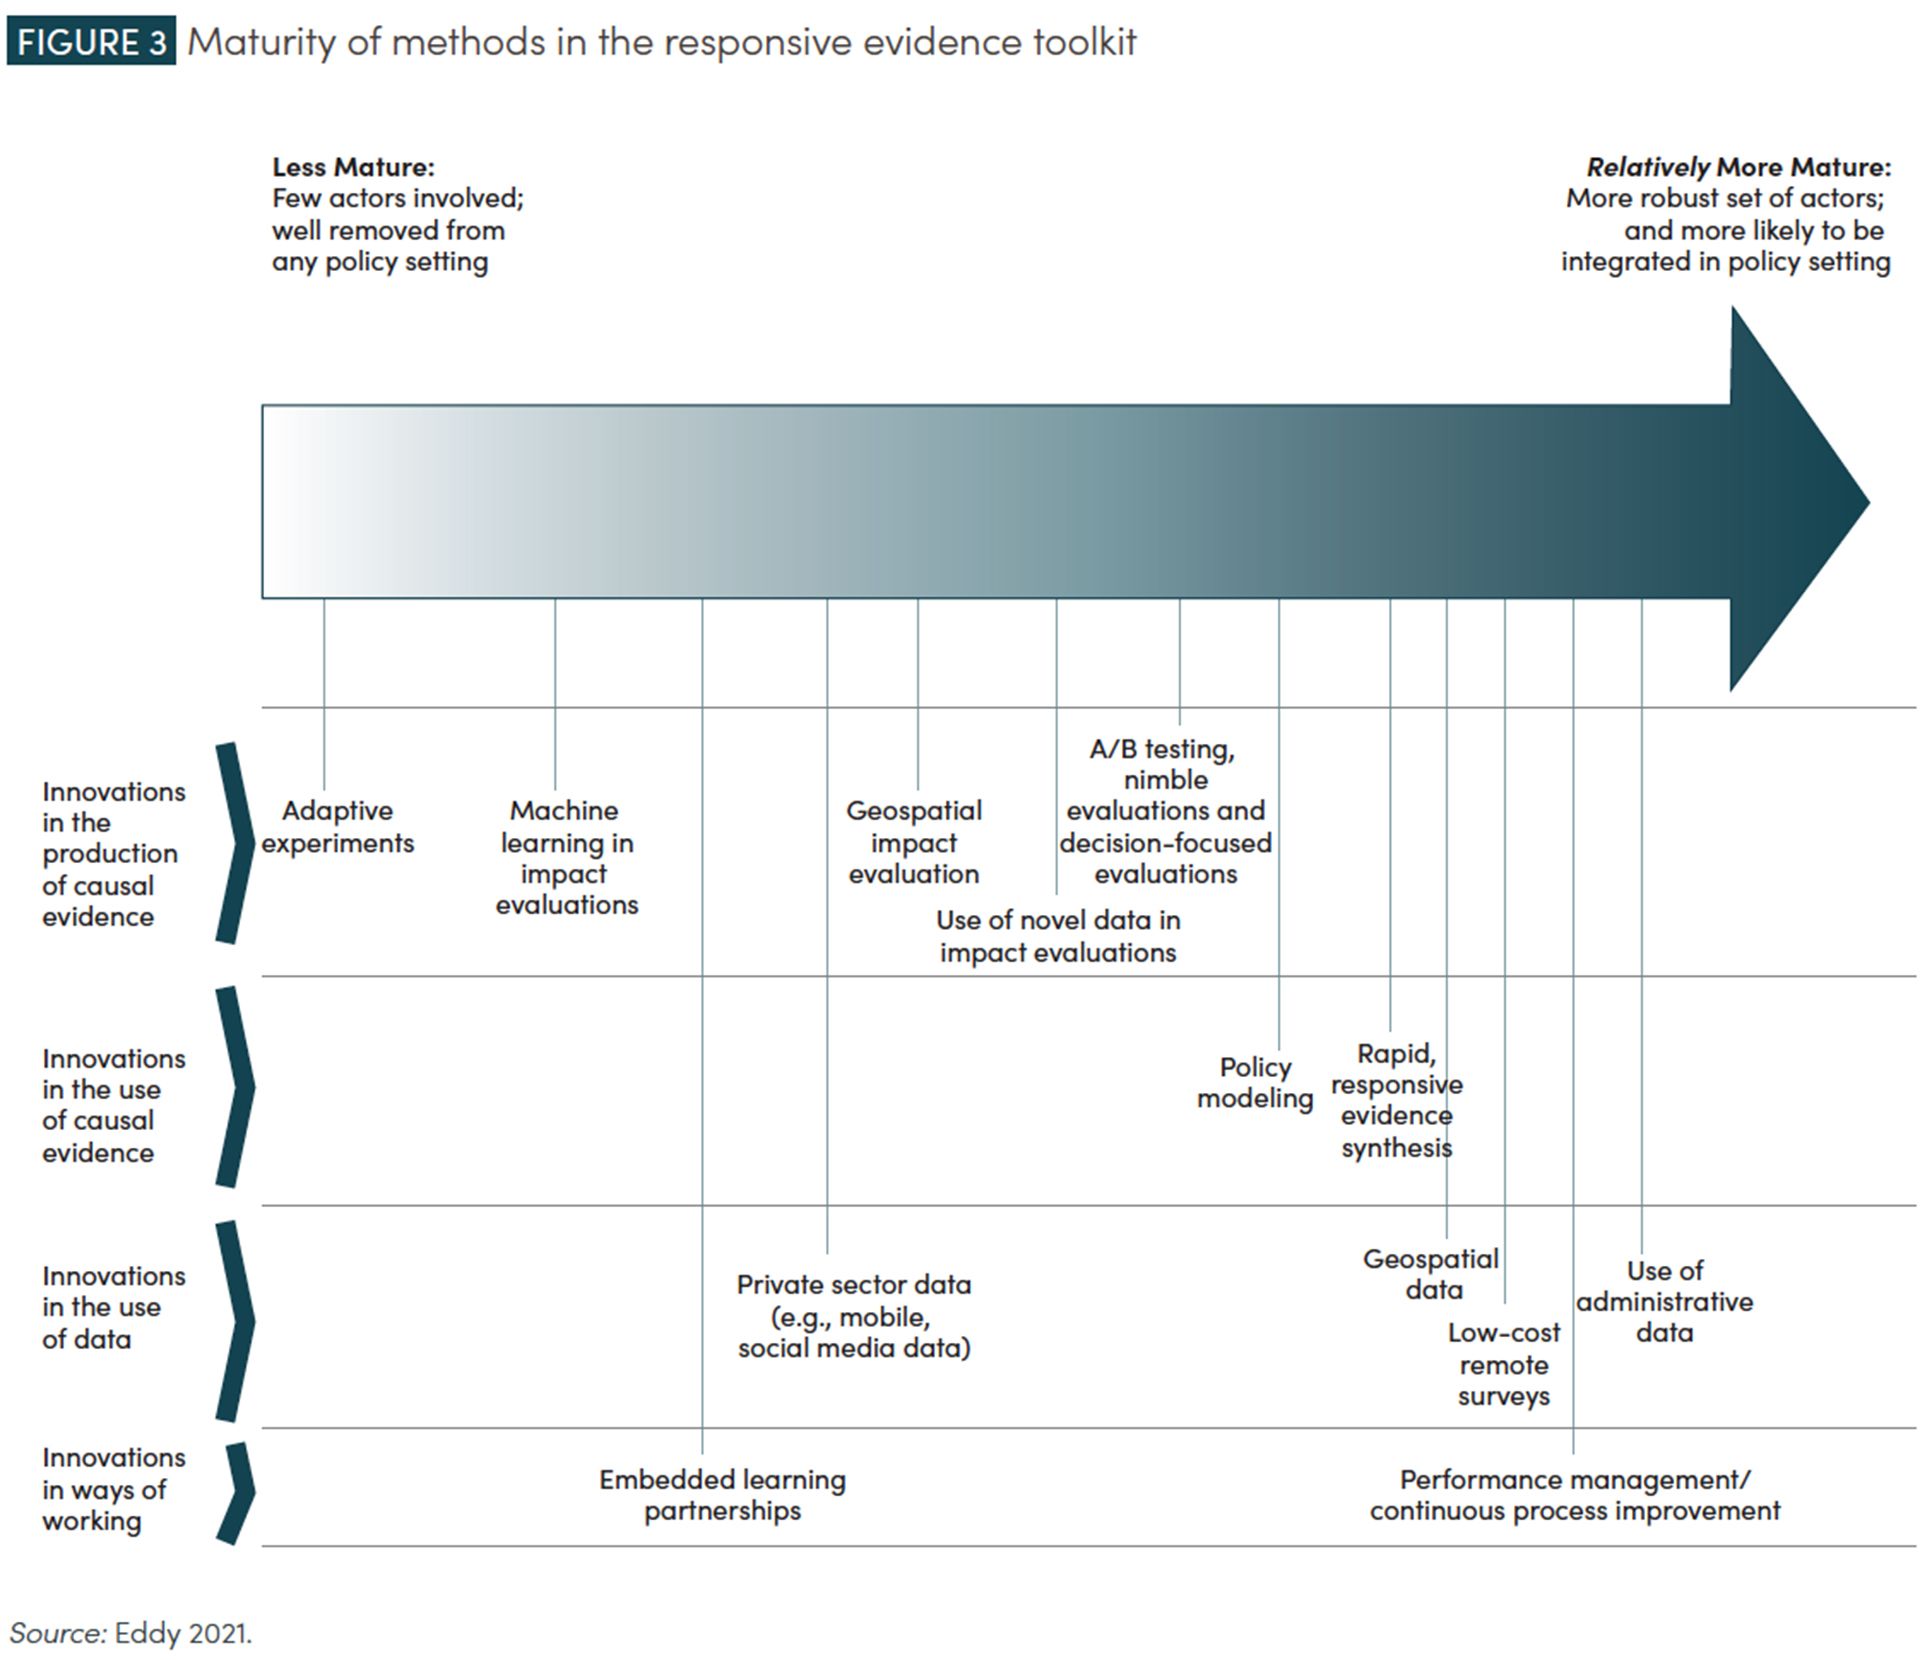
3. Notable advances in data and evaluation methodologies and practices enable faster, lower-cost, and/or larger scale evaluations.
A range of methodological approaches such as A/B testing with multiple treatment arms, adaptive evaluation, and “surrogate” proxies are enhancing the usability and relevance of experimental evidence for policy decisions. In tandem, technological advances in Wi-Fi, cell phones, GPS, and satellite imagery make it more feasible to gather and share data, while new types of software make data easier to combine, analyze, and use.
Relatedly, evaluations are increasingly conducted at large enough scale to credibly inform policy. Evidence at scale helps address policy-relevant questions about attributable impact in the context of real-world implementation challenges (Muralidharan and Niehaus 2017). Scale also allows for measurement of outcomes such as wages, prices, or outputs—first-order considerations for policymakers. Data digitization and scale go hand in hand, enabling “closed-loop” experimentation in which programs can be delivered and evaluated iteratively (Cole, Parienté, et al. 2020).

Box 1. Strengths, weaknesses, and examples of data enabling faster impact evaluation
1. Geocoded survey data collected through programs such as USAID’s Demographic and Health Surveys (DHS) Program, Afrobarometer, and national household surveys in many countries has become more readily available.
Read moreImpact evaluations using geocoded data from comprehensive surveys allow for flexibility in the level of analysis, ranging from the impact of a single intervention, to a specific donor’s projects, to all sector-specific projects across several countries. This flexibility makes these evaluations useful for governments interested in a broader understanding of the development effectiveness of certain implementers or within specific sectors. But since the surveys are not customized for each study, using geocoded data limits the scope of evaluations to the questions covered in the survey instrument at hand. Missing geographic areas and large time gaps between survey rounds can further compound data biases.
2. Administrative data refers to information originally collected and stored for operational purposes and record keeping rather than for evaluation (Feeney et al. 2019). Examples include medical records, insurance claims, labor statistics, tax records, sales records, land registry information, and so on. Using administrative data is less expensive than collecting new data; relieves survey fatigue for participants; ensures relatively comprehensive inclusion of study participants; mitigates risk of enumerator bias; allows for observation over long time horizons due to routine collection; and, if quality controls are significantly improved, can boost reliability through biometric and geocoded tagging (as opposed to self-reporting). But administrative data is not without downsides. The data can be biased if the program being evaluated affects the likelihood of appearing in the data (e.g., crime reports or hospital records); often requires time-intensive (and potentially expensive) cleaning and digitalization; and introduces ethical considerations related to privacy. More broadly, administrative data is often not available for comparison groups, meaning that it may not allow for assessing the comparative effectiveness of a program. Given that administrative data collection is not designed for specific studies, researchers commonly complement administrative data with survey, remote sensing, and/or other types of data collection to create datasets relevant to their specific research questions (as done by Banerjee, Duflo, et al. 2020 on a financial management reform in India). For a deeper dive, J-PAL’s Handbook on Using Administrative Data for Research and Evidence-based Policy (Cole, Dhaliwal, et al. 2020) is a comprehensive resource.
3. Remotely sensed data is provided by a growing number of initiatives, such as WorldPop, IPUMS TERRA, the US Geological Survey, and NASA’s Worldview. These offer public access to satellite imagery and other geographical and environmental data. Remotely sensed data can help overcome analytical challenges, including assessing pre-program trends, controlling for covariates, identifying heterogeneous effects, conducting robustness analyses, and assessing external validity for the country or regional context (Rathinam, Goldblatt, et al. 2020). For example, Burke and Lobell (2017) analyzed smallholder maize yield variation in Kenya using satellite imagery. And Yeh et al. (2020) utilize both satellite imagery and machine learning (ML) techniques to predict local wealth differences across 23 African countries. 3ie’s Big Data Systematic Map also includes 39 impact evaluations that use satellite data (Rathinam, Khatua, et al. 2020). Capacity-strengthening for geospatial impact evaluation could be immensely valuable (especially on the use of nighttime light to assess local economic performance) since the large amount of available satellite data and tools currently outweighs researchers’ capacity to conduct geospatial impact evaluation (Henderson et al. 2012). Capacity is also needed to validate and interpret remotely sensed data, as conducted by IDinsight and Radiant Earth for agriculture data on crop types and field boundaries (IDinsight 2022). Geospatial Analysis for Development (Geo4Dev), led by CEGA, New Light Technologies, and 3ie, provides public resources and capacity support for use of open-source geospatial tools.
4. Low-cost remote surveys have been used expansively during COVID-19. Remote tools include Computer-Assisted Telephone Interviewing (CATI), SMS or text message surveys, Interactive Voice Response (IVR) surveys, and online surveys, each with its own strengths and weaknesses (60 Decibels 2020). Remotely collected survey data risks excluding those without access to phones, computers, and/or internet; requires high literacy rates; and can receive low response rates. Nonetheless, remote options offer researchers significant flexibility to design their own survey instruments at relatively low cost, and remote surveys can be rapidly conducted by using existing sampling frames. For example, the Cox’s Bazar Panel Survey tracks a representative sample of displaced Rohingya households and their host communities and is designed to be a “sandbox” testing environment that streamlines data collection for numerous evaluations. CBPS was leveraged to track the impacts of COVID-19 on labor markets and wages as lockdowns began (World Bank 2020).
5. Big data can be drawn from the internet, social media, phone usage, satellite imagery, and so on (see 3ie’s Big Data Systemic Map). As technology generates huge volumes of real-time data on economic activity, infrastructure, migration, human behaviors and preferences, health conditions, and environmental characteristics (Bamberger and York 2020), ML techniques can be used to detect patterns and make inferences (McKenzie 2018; Paul et al. 2018; Rathinam, Thissen, and Gaarder 2021). For example, Leo et al. (2020) use ML techniques to assess vulnerability to climate change in Mali and Malawi. Studying an emergency COVID cash transfer program in Togo, Aiken et al. (2022) show that data from mobile networks can improve the targeting of humanitarian aid by training ML algorithms to recognize patterns of poverty in mobile phone data. Related work in Afghanistan to assess how well ML techniques differentiate ultra-poor households eligible for program benefits from ineligible poor households found ML methods using mobile phone data to be just as accurate as standard surveys in identifying ultra-poor households (Aiken et al. 2020). The study also found that households with phones were wealthier than those without, surfacing a key limitation of ML techniques: those with less access to digital tools will be less represented in the data. ML approaches also introduce concerns related to privacy, transparency, interpretability, and accountability (African Development Bank 2020).
Source: Isaksson 2021.
4. Impact evaluations increasingly involve, or are accompanied by, complementary quantitative and qualitative methods that enhance the ability to derive policy-relevant inferences and implications, such as observational and monitoring data and participant interviews that shed light on underlying reasons why an intervention is (in)effective and other relevant contextual and observational insights.
Despite its importance, cost analysis remains rare
Cost analysis is a key example of complementary evidence that is crucial to informing policy and deciding how to allocate scarce resources. Despite its importance, cost analysis remains rare. Research suggests that as of 2019 only one in five impact evaluations integrate cost evidence (Brown and Tanner 2019; see Box 2 for more examples). But efforts like the Costing Community of Practice, consisting of CEGA, 3ie, International Rescue Committee (IRC), J-PAL, IPA, Evidence Action, the World Bank, and others, are underway to address barriers to generating more and better cost evidence produced in conjunction with impact evaluations. Further, since 2016, the IRC has undertaken cost-efficiency and cost-effectiveness analysis of different interventions to make comparisons across programs and identify the best humanitarian approaches for a given cost (IRC 2016).
Box 2. Cost analysis is overlooked
Approximately 19 percent of the World Bank’s impact evaluations include any kind of value-for-money analysis (Brown and Tanner 2019).
Across all impact evaluations in 3ie’s database, the percentage that include value-for-money analysis has not changed much over time, staying around 15 percent (Brown and Tanner 2019).
Out of 145 recent empirical studies in education, about one-quarter include detailed costing analysis (Evans and Acosta 2021).
Out of 50 evaluations of at-scale health programs that used rigorous methods to attribute impact (out of a total of 250 evaluations), only three estimated cost-effectiveness (Glassman and Temin 2016).
Source: Isaksson 2021.

5. The application of impact evaluation tools has expanded to new domains, such as deforestation and women’s empowerment, which have historically received minimal attention from the development research and evaluation community. However, evidence in other areas, such as what works best in fragile settings and the relationship between environmental and poverty reduction interventions, remain understudied (Alpízar and Ferraro 2020). Impact evaluation distribution by sector is concentrated in health, social protection, and education.